Businesses today generate data through websites, applications, sales systems, social media, customer interactions, and digital platforms. But collecting data is only the beginning. The real value comes from understanding that data and converting it into useful information for business decisions.
This is why Data Analytics has become an important skill for students, graduates, professionals, and people planning a career in technology and business intelligence.
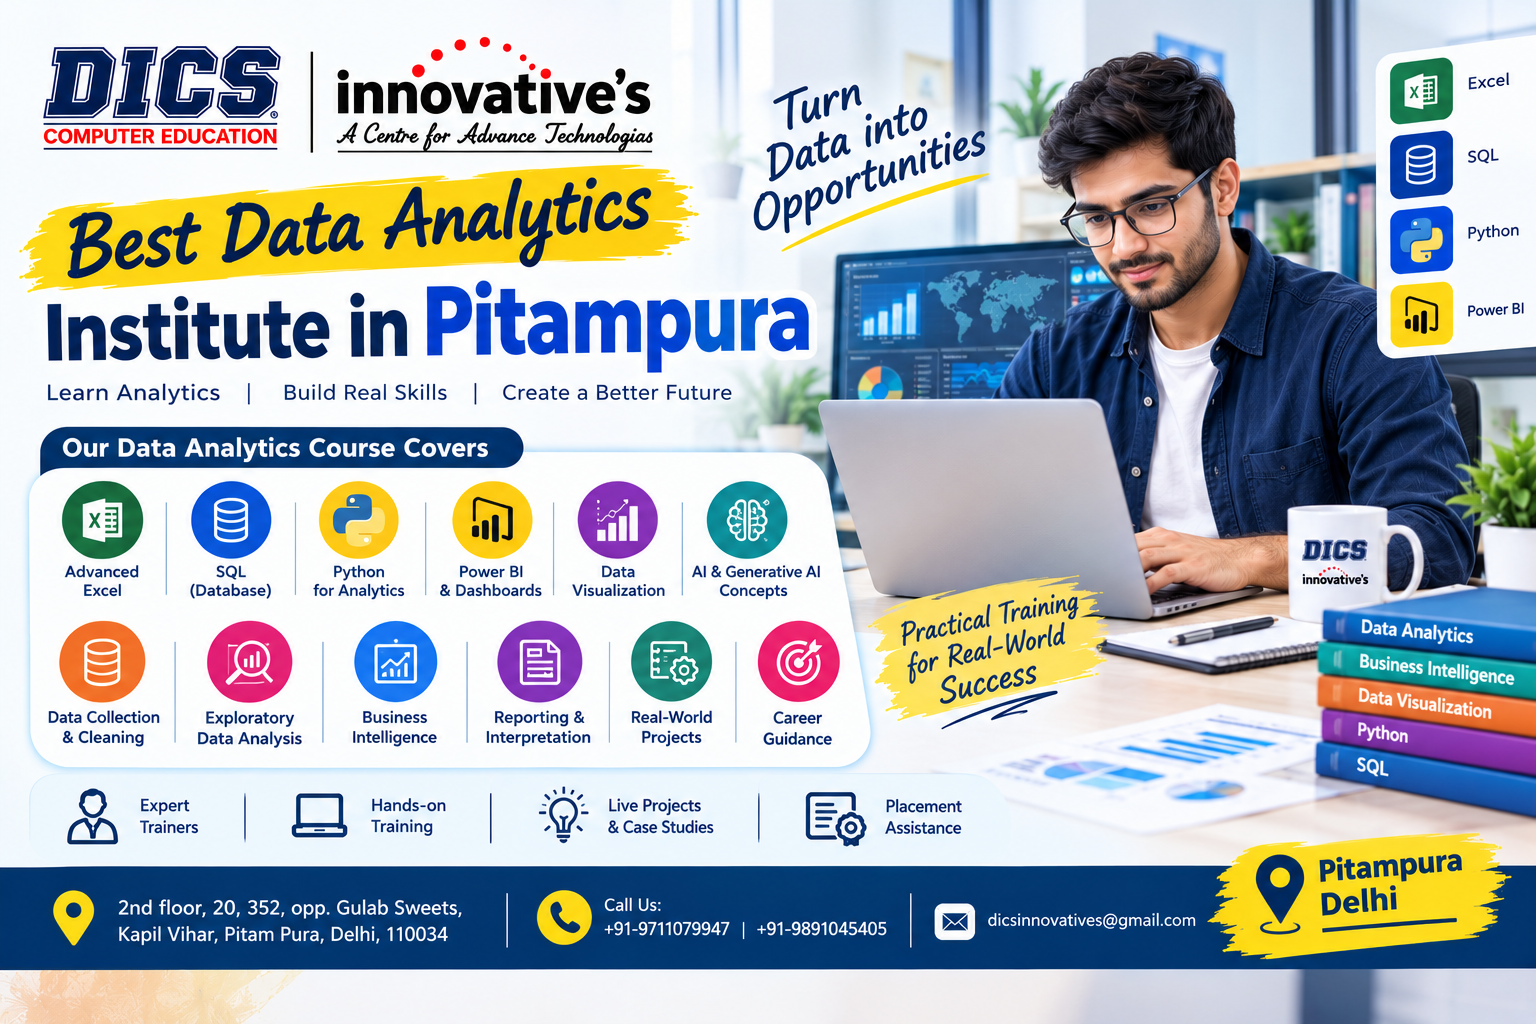
If you are searching for the Best Data Analytics Institute in Pitampura, DICS Innovatives offers practical and career-oriented training designed to help learners understand modern analytics tools, techniques, dashboards, and real-world data problems.
From Numbers to Insights: Understand How Data Works
Data Analytics is the process of examining information to discover patterns, trends, relationships, and useful insights. A data professional may work with sales figures, customer information, marketing performance, financial records, website data, or operational reports.
The Data Analytics Course in Pitampura at DICS Innovatives focuses on helping learners understand this complete journey. Students can learn how to organize raw information, clean datasets, analyze data, visualize findings, and communicate results through meaningful reports.
The goal is not simply to learn software commands but to understand how those tools are used to answer practical business questions.
Learn the Complete Data Analytics Workflow
Professional analytics work usually involves several connected stages. Understanding this workflow can help learners approach data problems in a structured way.
The training covers concepts related to:
- Data collection and organization
- Data cleaning and preparation
- Exploratory data analysis
- Database and SQL concepts
- Spreadsheet-based analysis
- Data visualization
- Dashboard development
- Business Intelligence
- Reporting and interpretation
- AI and Generative AI concepts
- Practical projects and case studies
This broad learning approach gives students an opportunity to understand how different parts of data analytics connect with one another.
Build Your Skills with Excel, SQL, Python and Power BI
Modern analytics involves multiple technologies, and each one can serve a different purpose.
Advanced Excel for Data Analysis
Excel remains an important tool for organizing information, performing calculations, creating reports, using Pivot Tables, analyzing datasets, and preparing business reports. Advanced Excel skills can provide a useful foundation for beginners entering analytics.
SQL for Working with Databases
Large organizations often store information in databases. SQL helps professionals retrieve, filter, combine, and analyze data stored in database systems.
Students can learn SQL concepts and practice queries to understand how information can be extracted for analytical purposes.
Python for Analytics
Python can be used for data manipulation, analysis, automation, and working with datasets. Learning Python can help learners move beyond spreadsheet-based analysis and explore programming-based approaches to handling data.
Power BI for Interactive Dashboards
Power BI allows data to be transformed into interactive dashboards and reports. Learners can understand how to present analytical findings through visualizations that make trends and important metrics easier to interpret.
Practice Instead of Only Studying Theory
Data Analytics is a skill that becomes stronger through practice. Reading about formulas, queries, programming, or dashboards is useful, but applying those concepts to datasets provides a different learning experience.
DICS Innovatives emphasizes hands-on activities where students can practice data preparation, analysis, visualization, and reporting.
Create Dashboards That Communicate Clearly
A dashboard should do more than display numbers. It should help the viewer understand important information quickly.
During training, learners can explore how charts, graphs, tables, filters, KPIs, and other visual elements can be combined to create meaningful reports.
Power BI and data visualization concepts can help students understand how complex datasets can be transformed into visual stories that are easier for business users to understand.
Discover the Connection Between Data Analytics and AI
Artificial Intelligence and Generative AI are becoming increasingly relevant to modern technology workflows. AI tools can assist with productivity, data exploration, automation, summarization, and other tasks. For aspiring data professionals, understanding the relationship between traditional analytics and emerging AI technologies can provide useful knowledge about the changing digital environment.
DICS Innovatives includes AI and Generative AI concepts in its analytics training approach so learners can become familiar with how these technologies may complement data-related work.
Who Can Enroll in a Data Analytics Course?
Data Analytics can be learned by people from different educational backgrounds. Students, graduates, working professionals, job seekers, and individuals interested in technology can develop analytics skills.
The course can be particularly relevant for learners who want to strengthen their knowledge of:
- Business reporting
- Data analysis
- Business Intelligence
- Data visualization
- Database management
- Digital business operations
- Technology and analytics
Beginners can start with fundamentals and gradually progress toward more advanced tools and practical projects.
Develop Analytical Thinking Alongside Technical Skills
Knowing Excel, SQL, Python, or Power BI is valuable, but data analytics also requires the ability to think logically about information. A good analyst needs to understand the question behind the data, identify relevant information, recognize unusual patterns, and communicate findings clearly.
The Data Analytics Course in Pitampura at DICS Innovatives combines technical learning with practical exercises to help students develop a more structured approach to solving data-related problems.
Build Projects for Practical Experience
Projects give learners an opportunity to bring different skills together. A project might involve taking a dataset, cleaning the information, analyzing important metrics, developing visualizations, creating a Power BI dashboard, and presenting the final findings.
Working through this process can help students understand how multiple analytics tools are connected in a practical environment. Project experience can also provide material that learners may use when demonstrating their skills during interviews or professional discussions.
Career Paths After Data Analytics Training
Data is used across industries such as IT, finance, e-commerce, marketing, healthcare, logistics, education, and business services.
Depending on their qualifications, skills, and experience, learners can explore roles including:
- Data Analyst
- Junior Data Analyst
- MIS Analyst
- Reporting Analyst
- Business Analyst
- Business Intelligence roles
- Data Reporting Executive
A training course is only one part of career development. Practical ability, project experience, communication, problem-solving, and professional experience also contribute to career opportunities.
What Should You Check Before Joining a Data Analytics Institute?
Choosing an institute should involve more than comparing course names. Students should examine the curriculum, technologies covered, practical training, project work, trainer guidance, learning methodology, and exposure to current industry practices.
A useful program should help learners understand both the technology and the reasoning behind data analysis. For students comparing options for the Best Data Analytics Institute in Pitampura, these factors can provide a practical framework for evaluating different training programs.
Why Learn Data Analytics at DICS Innovatives?
DICS Innovatives provides career-focused computer and technology education with an emphasis on practical learning. The Data Analytics program brings together Advanced Excel, SQL, Python, Power BI, Data Visualization, Business Intelligence, AI & Generative AI concepts, and practical projects.
Learners can build their understanding progressively—from fundamental data concepts to analysis, visualization, dashboards, and practical applications. The Pitampura location also provides a convenient classroom learning option for students and professionals from nearby areas.
Start Building Your Data Skills
Data Analytics combines technology, numbers, business understanding, and problem-solving. Learning the right tools is important, but developing the ability to interpret information and communicate insights is equally valuable.
If you are looking for the Best Data Analytics Institute in Pitampura or planning to join a Data Analytics Course in Pitampura, DICS Innovatives provides a structured environment for learning essential analytics technologies and practicing their application.
Frequently Asked Questions
- Which is the Best Data Analytics Institute in Pitampura?
DICS Innovatives offers Data Analytics training in Pitampura covering Advanced Excel, SQL, Python, Power BI, data visualization, Business Intelligence, AI concepts, and practical projects.
- What is included in a Data Analytics Course in Pitampura?
A Data Analytics Course can include data cleaning, analysis, Excel, SQL, Python, Power BI, visualization, dashboard creation, reporting, Business Intelligence, and practical project work.
- Can students from a non-technical background learn Data Analytics?
Yes. Learners from different educational backgrounds can begin with fundamental concepts and gradually develop technical and analytical skills through structured training and practice.
- Why should I learn SQL for Data Analytics?
SQL is useful for working with databases. It allows analysts to retrieve, filter, combine, and organize information that can then be used for analysis and reporting.
- Is Power BI useful for a Data Analyst?
Power BI is a popular business intelligence and visualization platform that can be used to create interactive reports and dashboards. Learning it can help learners present analytical findings in a clear visual format.